Spectrograms with FFMpeg
In this post I’ll be covering how to create image files that represent the sound levels and frequencies of a media file. These images are known as spectrograms. They provide a way to visually locate moments in time. This can be useful for a number of reasons.
FFMpeg has a feature that lets us create spectrograms with the showspectrumpic filter. Details about this filter can be found here, https://ffmpeg.org/ffmpeg-filters.html#showspectrumpic. You can also get information about the filter by typing in this command.
ffmpeg -h filter=showspectrumpic
There are a few options for the filter I would like to point out. These are Size, Gain, Color, and Orientation. There are other options as well, but these are advanced concepts beyond the scope of this post, maybe in another post.
The Size filter option lets you choose the dimensions of the spectrogram image. One thing to keep in mind is that spectrogram function creates a padded boarder around the actual spectrogram. It follows a consistant pattern of 116 pixels on each side and 64 pixels above and below the spectrogram. This will be worth noting when I demonstrate some advanced uses of this topic.
Lets create a spectrogram with the default options. Use this command, replace the input and output file names to suit your needs.
ffmpeg -i audio-in.wav -lavfi showspectrumpic image-out.png
This should create an image file fairly quickly with the default dimensions of 4328 x 2176. The actual spcetrogram is 4096 x 2048 if we remove the scale padding that boarders the spectrogram. If you reference the filter help file, it states this, (default “4096×2048”). For my purposes, I prefer to lower it down so I can read the scale information. I use this command with my options to get my intended results.
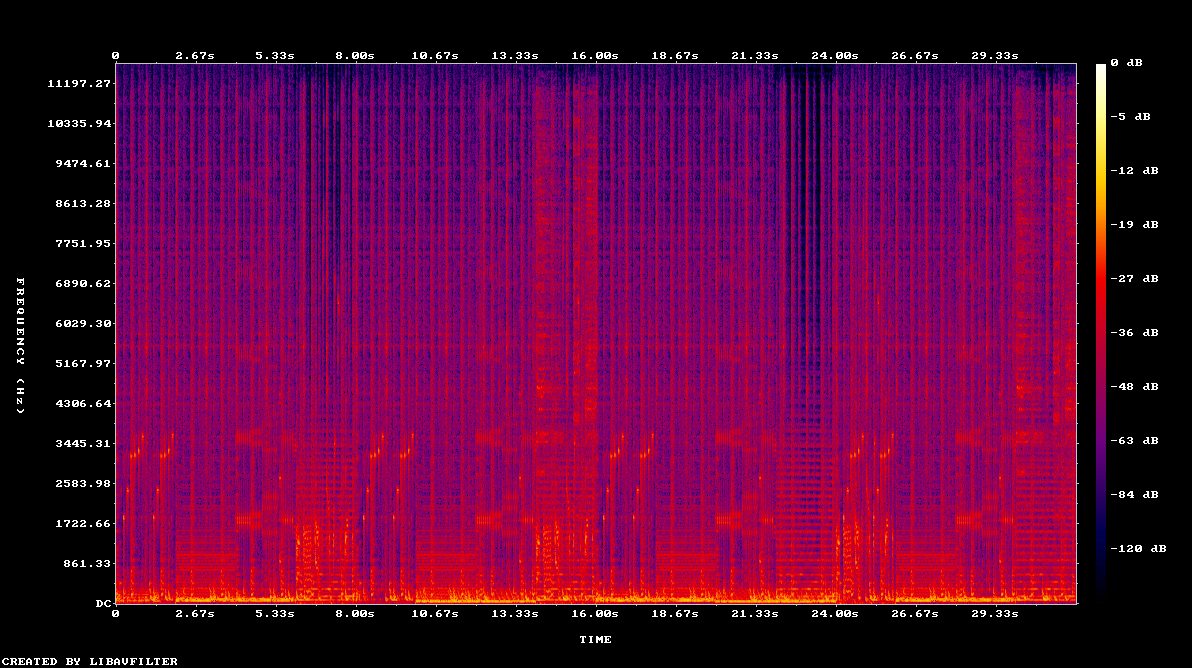
ffmpeg -i audio-in.wav -lavfi showspectrumpic=s=960x540 image-out.png
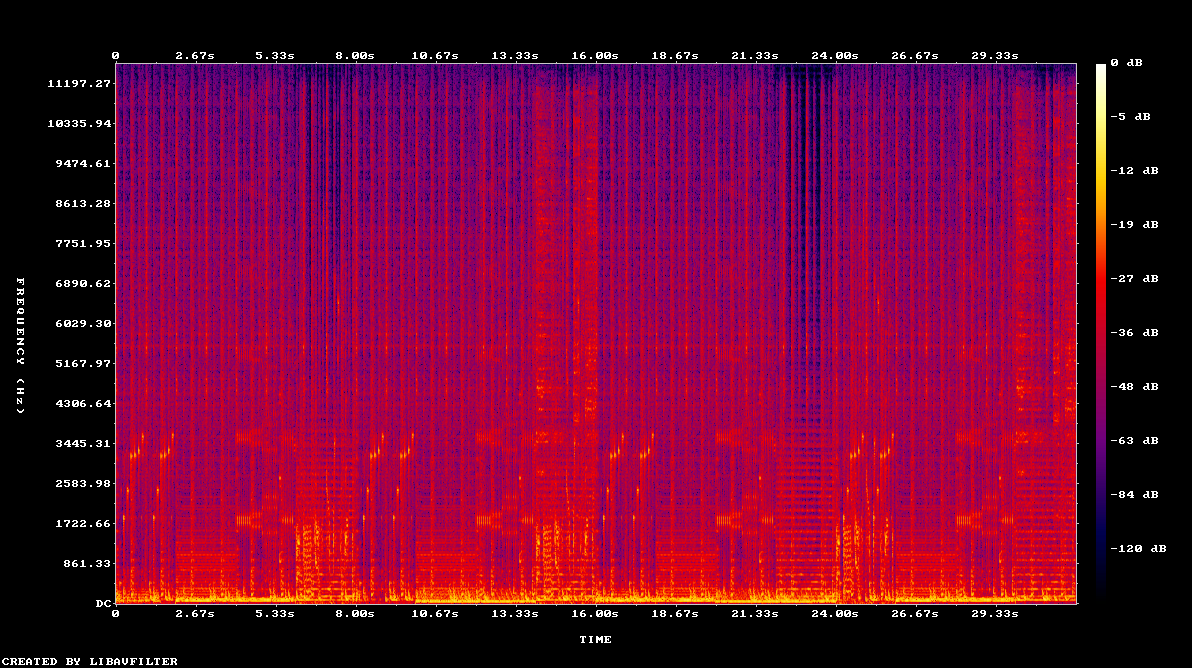
Now I can read the time and frequency scales easier. Change the scale around, try different options.
Next I’m going to cover Orientation. The only time you would use this filter is when you want the frequency scale to run horizontal. It runs vertical by default. Use this command to change the orientation.
ffmpeg -i audio-in.wav -lavfi showspectrumpic=s=960x540:orientation=1 image-out.png
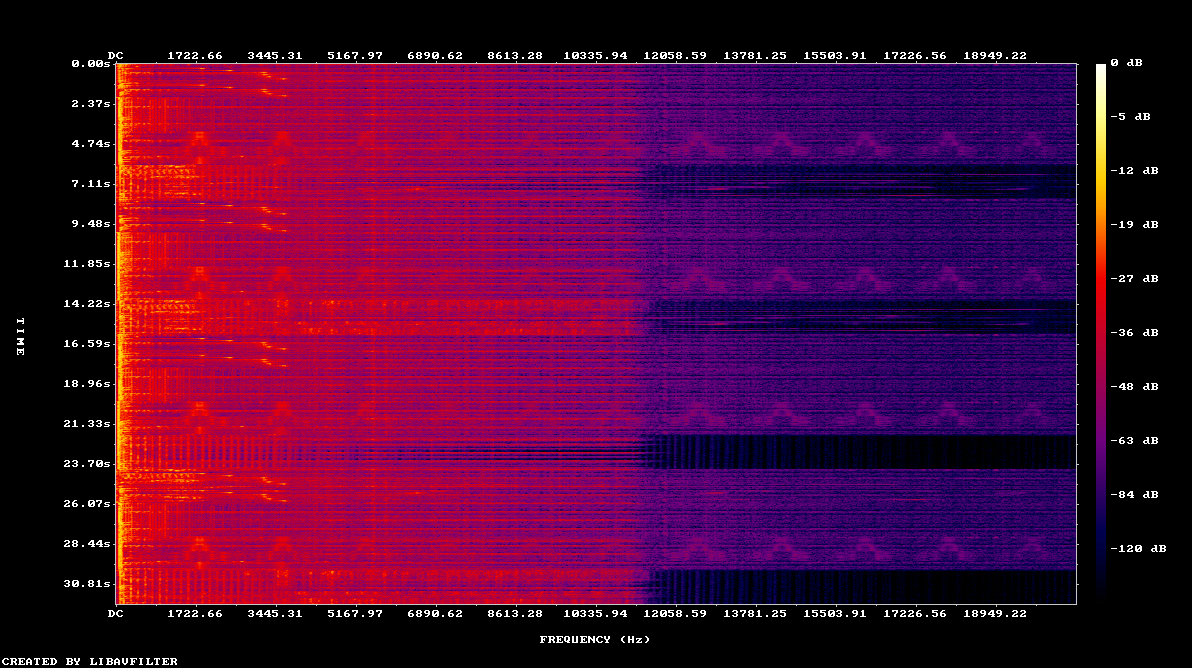
The start of the sound begins at the top of the image, while the bottom is the end of the file. You can also see a much higher range of 20Khz in the frequency scale when we change the orientation. It appears to top out at 12Khz on the default orientation, something to note.
Now let’s change the color of our spectrogram that reflects sound levels at different frequencies. There are 9 possible options available, which I won’t demonstrate all here. So far we have used the default “intensity” color setting. Here is the command to change it to the “fiery” color setting.
ffmpeg -i audio-in.wav -lavfi showspectrumpic=s=960x540:color=6 image-out.png
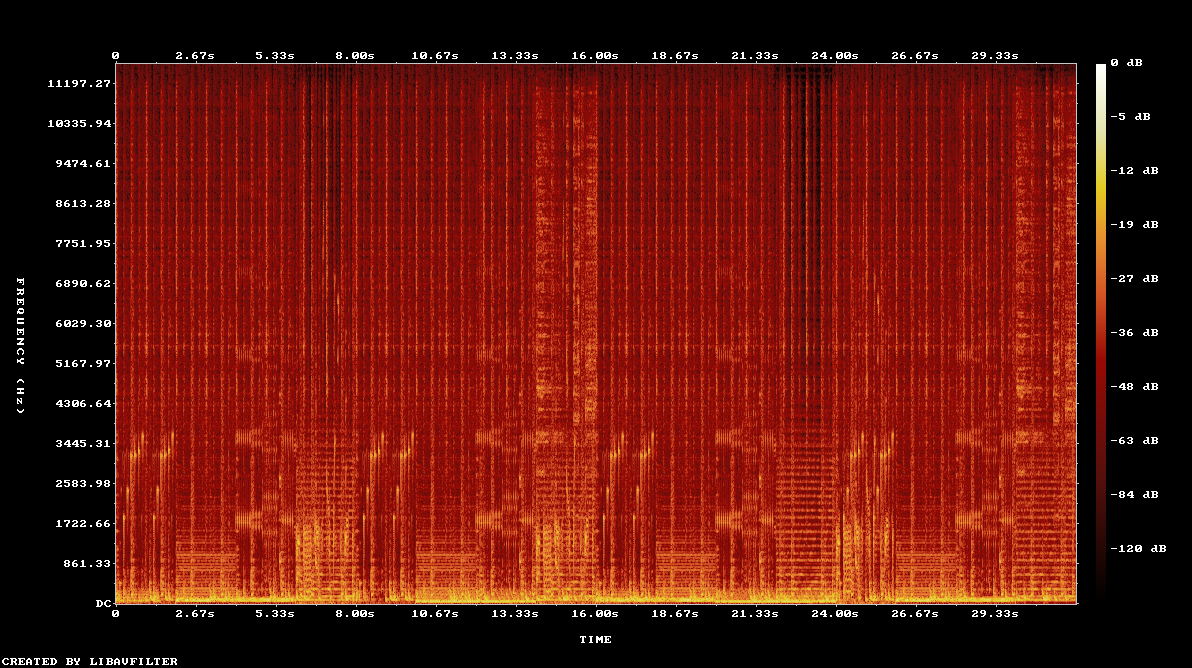
Some of the details become clearer when color scales are changed. Try different color scales to see how your sound information changes in the spectrogram. Some higher or lower frequencies become easier to see.
The last filter option I would like to cover is gain. The gain scale has a default value of 1 and can range from 0 to 128 with floating point values. Setting a gain of less than 1 decreases the sound level, whereas setting it higher increases it. Here are two commands to set higher and lower gain levels.
ffmpeg -i audio-in.wav -lavfi showspectrumpic=s=960x540:gain=5 image-out.png
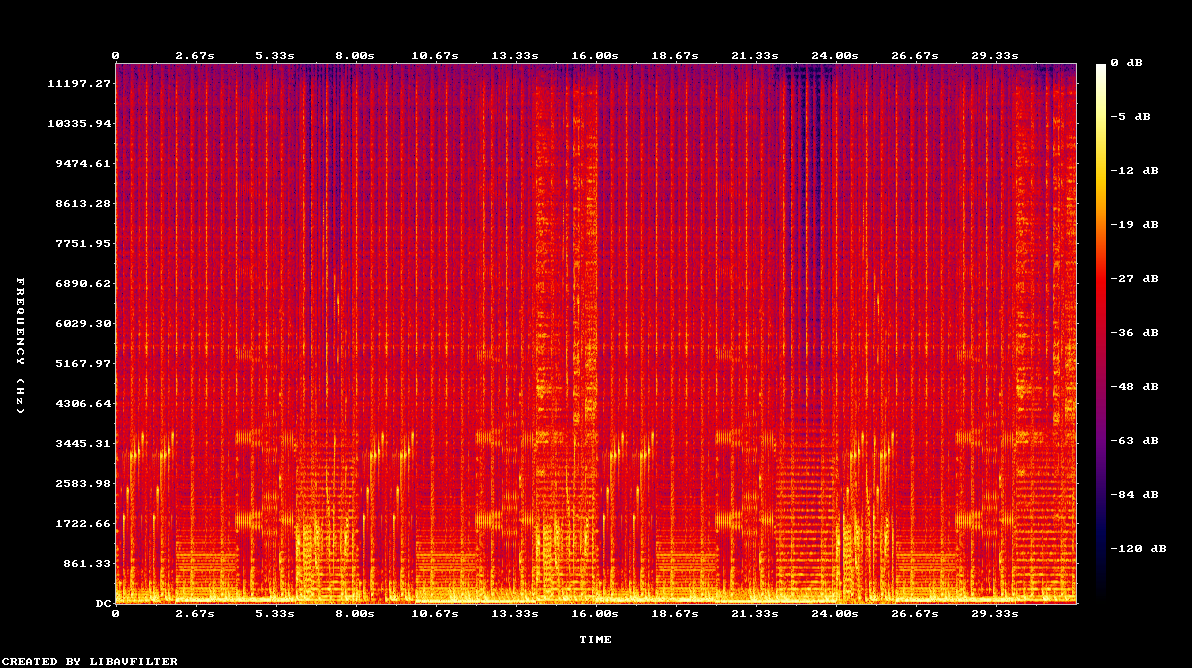
ffmpeg -i audio-in.wav -lavfi showspectrumpic=s=960x540:gain=.5 image-out.png
This is just another method to draw attention to sound levels that would normally be hard to spot with the default gain values.
There are other filter options, such as window function, which I won’t cover here. You can see that there are many possiblities available for rendering spectrographic images of sound media using FFMpeg.
I would like to also demonstrate another tool called Sox that does a similar, but more limited rendering of spectrograms. Install Sox if you haven’t already with this command
sudo apt-get install sox
After the install, you can create a spectrogram using this command.
sox audio-in.wav -n spectrogram
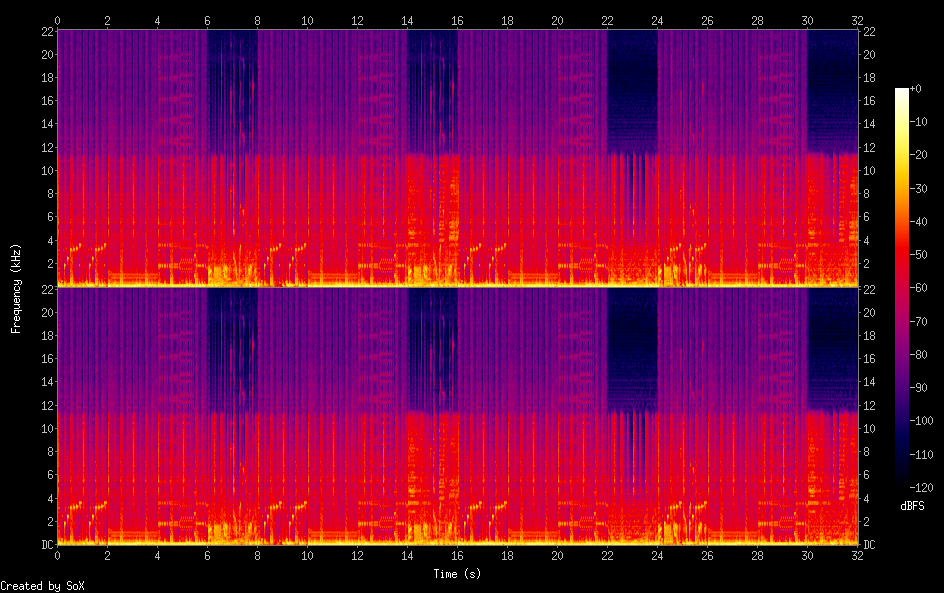
This will create an image file in the working directory where you ran the command. There aren’t as many options available to Sox as there are with FFMpeg, but you get the idea on some of the basic uses.
Spectrograms are interesting ways to represent sound data. There is much more that can be done with spectrograms than I’ve covered here. I hope you have found this introduction useful. In the coming weeks I’ll be covering more audio specific topics and we’ll return to spectrograms and there uses.